SAT: Math: Problem-Solving and Data Analysis
What ratios, percentages, probability, and data displays actually mean
On the exam: Ratios, percentages, probability, reading tables and scatterplots. About 15%.
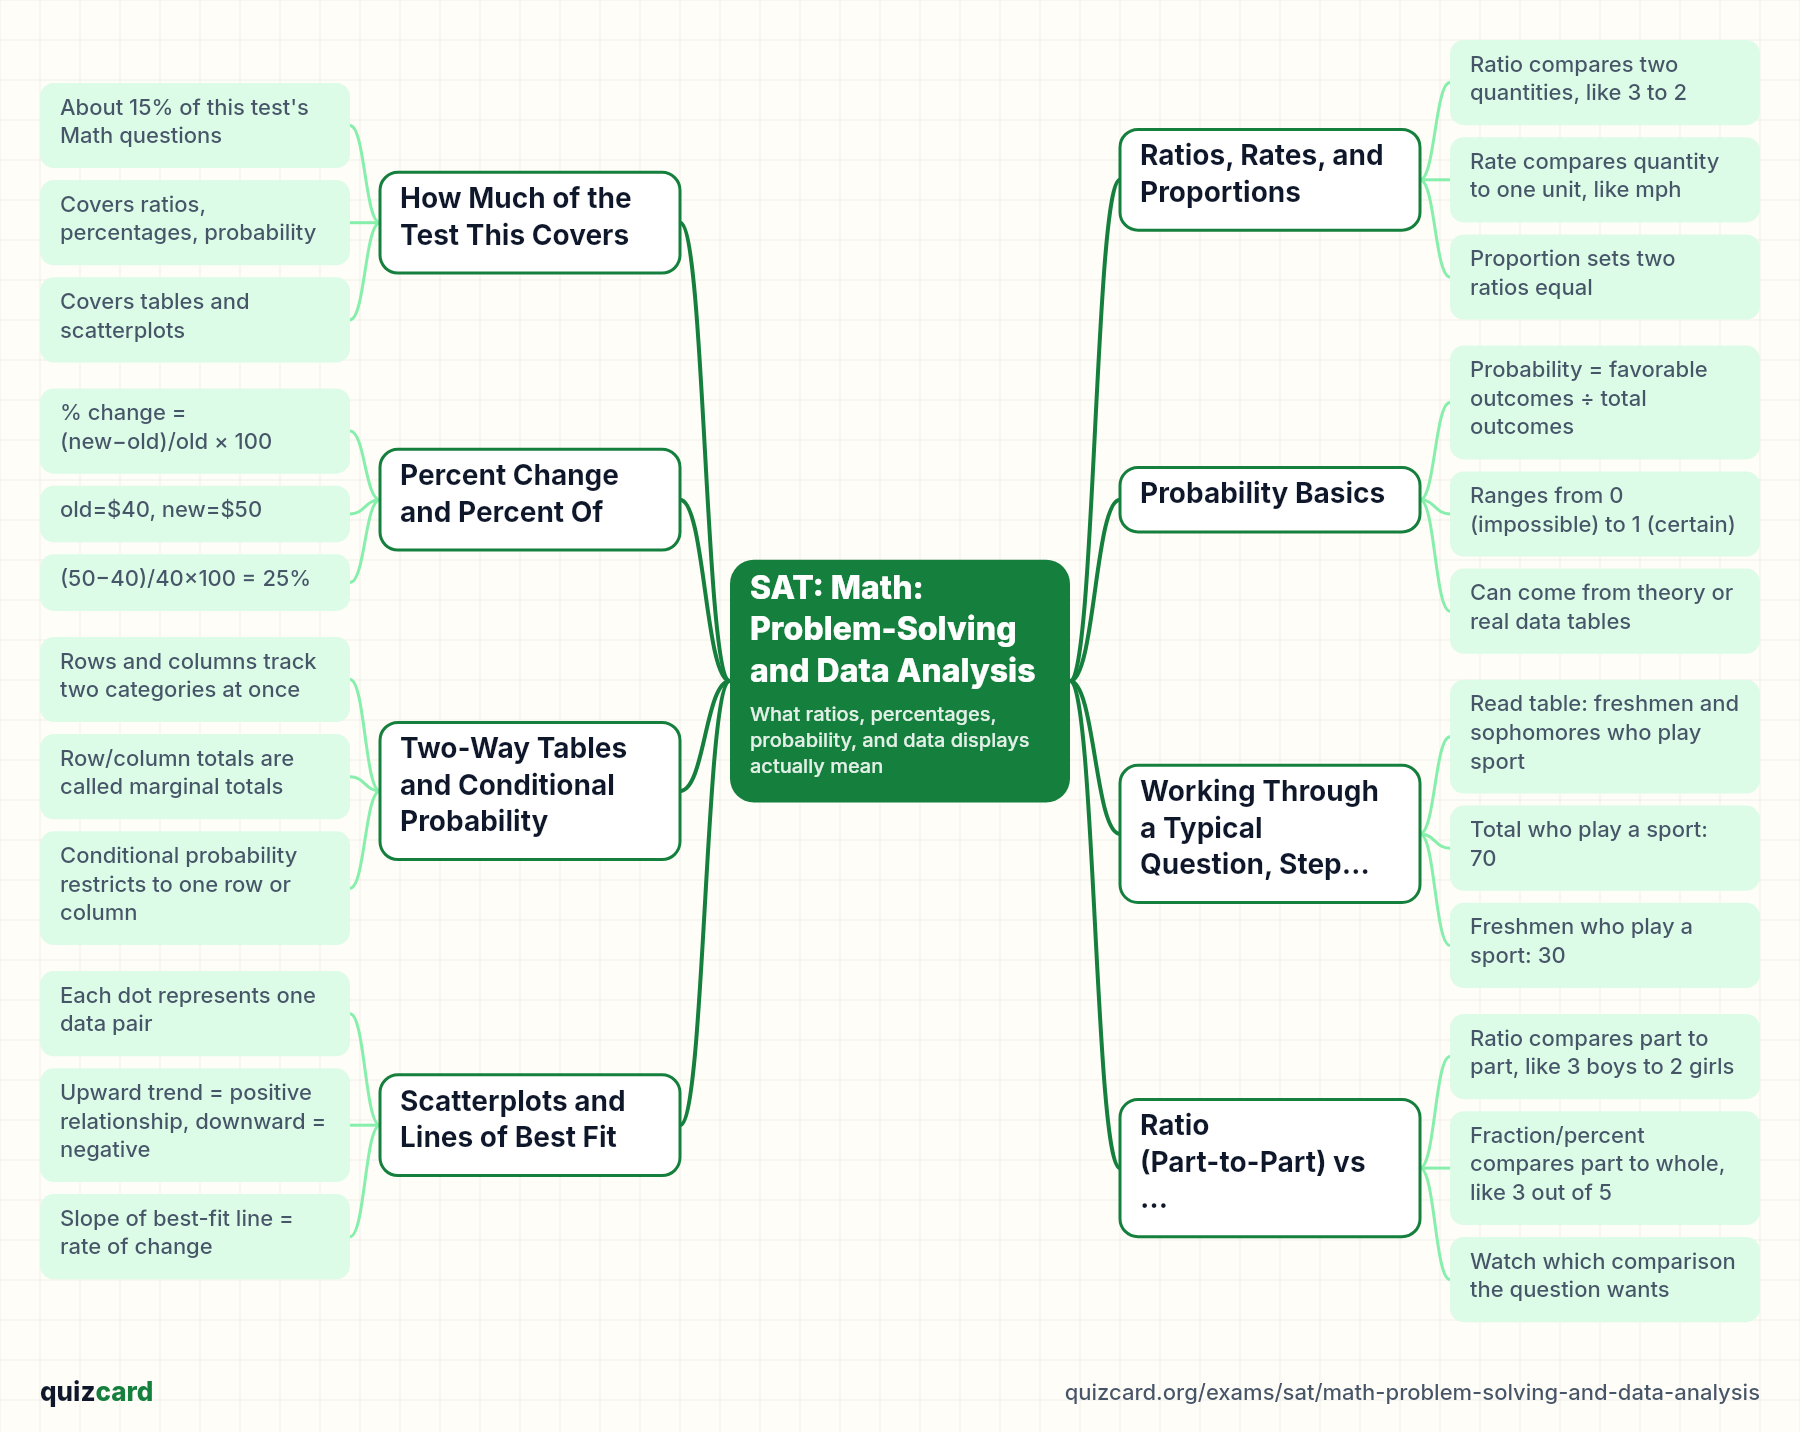
Think a ratio and a percent are the same thing? On the SAT, that mix-up costs real points in Problem-Solving and Data Analysis, about fifteen percent of the Math section. We'll cover ratios, percentages, probability, tables, and scatterplots, then work through a typical question step by step.
How Much of the Test This Covers
Problem-solving and data analysis makes up about fifteen percent of this section of the test, around nine or ten questions out of fifty-eight. Instead of pure algebra, these questions test whether you can read a table, compute a percent change, or figure out a probability from real-world data. That makes this topic less about formulas and more about careful reading and arithmetic.
15% share of the Math test devoted to problem-solving and data analysis
Key points.
- About 15% of this test's Math questions
- Covers ratios, percentages, probability
- Covers tables and scatterplots
- Tests reading and reasoning, not just formulas
Ratios, Rates, and Proportions
A ratio compares two quantities directly, like three cups of flour to two cups of sugar, written three to two. A rate compares a quantity to one unit, like fifty-five miles per hour. A proportion sets two ratios equal so you can solve for an unknown: if three is to two as nine is to what, you cross multiply, three times what equals two times nine, so what equals six.
Key points.
- Ratio compares two quantities, like 3 to 2
- Rate compares quantity to one unit, like mph
- Proportion sets two ratios equal
- Cross-multiply to solve for unknown
Percent Change and Percent Of
Let's write the percent change formula: new minus old, divided by old, times one hundred. Say a shirt's price goes from forty dollars to fifty dollars. Fifty minus forty is ten, divided by forty is point two five, times one hundred gives twenty-five percent increase. For 'percent of', just multiply: twenty percent of one hundred fifty is point two zero times one hundred fifty, which is thirty.
% change = (new−old)/old × 100
old=$40, new=$50
(50−40)/40×100 = 25%
part = percent × whole
20% of 150 = 0.20×150 = 30
Key points.
- Percent change = (new − old) ÷ old × 100
- Shirt example: $40 → $50 is a 25% increase
- Percent of = percent × whole
- 20% of 150 = 30
Probability Basics
On the SAT, probability almost always comes from this one idea: favorable outcomes over total outcomes. Roll a six-sided die, and the probability of landing on a four is one out of six. Often the SAT gives real data, like a bag with twenty marbles where five are red; then probability of picking red is five over twenty, one fourth, or twenty-five percent.
Probability equals the number of favorable outcomes divided by the total number of possible outcomes. SAT Math definition
Key points.
- Probability = favorable outcomes ÷ total outcomes
- Ranges from 0 (impossible) to 1 (certain)
- Can come from theory or real data tables
- Written as fraction, decimal, or percent
Two-Way Tables and Conditional Probability
Two-way tables sort data by two categories at once, like grade level and whether a student plays a sport. The edges of the table give marginal totals, the overall count for each row or column. Conditional probability means zooming into just one row or column: if fifty freshmen total, and thirty of them play sports, the probability a freshman plays a sport is thirty over fifty, or sixty percent.
Key points.
- Rows and columns track two categories at once
- Row/column totals are called marginal totals
- Conditional probability restricts to one row or column
- Divide the cell value by that total
Working Through a Typical Question, Step by Step
Here's a typical table question. A survey of two hundred students shows how many play a sport, by grade. Freshmen playing sport: thirty. Sophomores playing sport: forty. So seventy total play a sport. The question asks: probability a sport-player is a freshman? Take freshman-and-sport, thirty, divide by total sport-players, seventy, giving three sevenths, about forty-three percent.
- Read the table: sport vs grade, find totals
- Question asks: probability a sport-player is a freshman
- Total who play a sport = 70
- Freshmen who play a sport = 30
- Divide: 30 ÷ 70 = 3/7 ≈ 0.43
Scatterplots and Lines of Best Fit
A scatterplot plots pairs of data, like hours studied against test score, one dot per student. Dots trending upward show a positive relationship; downward shows negative. A line of best fit summarizes that trend: its slope gives the rate of change, say five extra points per hour studied, and its y-intercept predicts the score at zero hours. Points far from the line are outliers.
Key points.
- Each dot represents one data pair
- Upward trend = positive relationship, downward = negative
- Slope of best-fit line = rate of change
- Points far from the line are outliers
Ratio (Part-to-Part) vs Proportion (Part-to-Whole)
A classroom with three boys and two girls gives a ratio of three to two, boys to girls, a part-to-part comparison. But if you're asked what fraction of the class is boys, that's three out of five, or sixty percent, a part-to-whole comparison. Mixing these up is one of the most common errors: always check whether the question compares two groups to each other or one group to the total.
Ratio: Part to Part
- 3 boys to 2 girls
- Written 3:2
- Compares two groups directly
Fraction: Part to Whole
- 3 boys out of 5 students
- Written 3/5 or 60%
- Compares one group to everyone
Remember this
The one thing to remember: always check whether a question wants a ratio, a percent, or a probability, since the SAT loves testing that exact confusion. Try a few practice problems now and see how these ideas show up.
Practice this unit
- SAT Vocabulary: 40 High-Frequency Words quiz24 multiple-choice questions with explanations · no account needed
- Algebra and Geometry: Essential Formulas quiz18 multiple-choice questions with explanations · no account needed
- GRE Quantitative: Arithmetic, Algebra, Geometry and Data Formulas quiz15 multiple-choice questions with explanations · no account needed
- SAT Vocabulary: 40 High-Frequency Words40 flashcards · study free
- Algebra and Geometry: Essential Formulas30 flashcards · study free
- Geometry: Proofs, Triangles, and Circles30 flashcards · study free
- English Literature: Literary Terms and Devices30 flashcards · study free
Every SAT deck and quiz: the SAT hub.
Other SAT unit guides
- Math: Advanced MathStudy guide
- Math: AlgebraStudy guide
- Math: Geometry and TrigonometryStudy guide
- Reading and Writing: Craft and StructureStudy guide
- Reading and Writing: Expression of IdeasStudy guide
- Reading and Writing: Information and IdeasStudy guide
- Reading and Writing: Standard English ConventionsStudy guide
Try it with your own material
Upload a PDF, slides or notes and study the deck in minutes. Making your own cards is free with no limits.